ClimateKG: A knowledge graph for climate science
Suppose you are putting together a climate model ensemble. You have a list of models and their outputs, but you also want to know which models share an atmospheric component, which experiments they were used in, and which papers describe those choices. Answering that question can send you through model documentation, dataset metadata, and a growing pile of PDFs.
ClimateKG connects these pieces in a knowledge graph, so researchers can follow relationships between models, experiments, variables, methods, and publications.
In our paper, Ontology-Guided Knowledge Graph Construction from Structured Metadata and Climate Science Publications, my collaborators Qi Zhang, Eduard Dragut, Longin Jan Latecki, and I describe how we built this graph by combining established climate resources with information extracted from scientific papers. This post explains what is in it, where it could help a climate research workflow, and how to start exploring it.
Explore: Paper · Code and released data · Hugging Face dataset
What is a knowledge graph?
A knowledge graph represents things as nodes and their relationships as edges. In climate science, a node might represent a model, an experiment, an atmospheric variable, or a publication. An edge describes a specific connection between two nodes.
For example, the paper uses CESM2 and its atmospheric component CAM6 to illustrate relationships of this form:
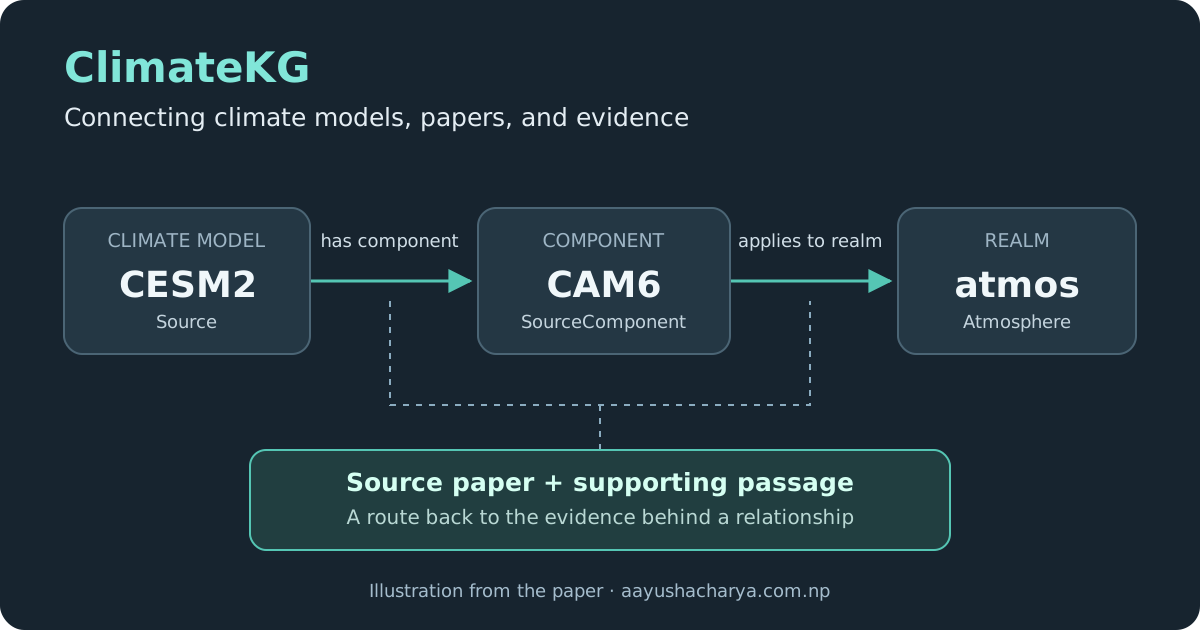
An illustration based on the paper's CESM2/CAM6 example, rather than the output of a dataset query. The graph uses the identifier atmos for the atmosphere realm.
Each individual connection is a triplet: a subject, a relationship, and an object. For example, “CESM2 — has component — CAM6.” Linking these triplets lets us ask questions that require several steps, such as finding the atmospheric components of models mentioned in a collection of papers.
The graph also uses an ontology: a shared definition of the kinds of entities and relationships it can contain. Think of it as a set of rules for organizing the information. A climate model can have a model component, and a component can apply to a realm such as the atmosphere or ocean. Those rules help keep extracted relationships consistent.
For relationships extracted from publications, ClimateKG also retains the supporting text and paper identifiers. This makes it possible to inspect why a connection was added and return to its scientific context.
What is in ClimateKG?
ClimateKG combines two sources of information.
The first is a structured foundation built from ESGF dataset metadata, CMIP6 controlled vocabularies, NASA GCMD keywords, and GeoNames. These resources supply established identifiers and concepts for models, experiments, variables, institutions, and places.
The second is information extracted from scientific publications. Papers add relationships and research context that dataset metadata alone may not capture, including methods, observational datasets, instruments, physical schemes, metrics, and reported results.
The graph reported in the paper, Table 5, has:
| Measure | Reported value |
|---|---|
| Publications processed | 2,000 |
| Nodes | 133,990 |
| Relationships | 755,308 |
| Publication triplets retained after validation | 23,327 |
These numbers describe different things. The total relationship count includes metadata connections, publication links, and other graph structure. The 23,327 validated triplets are publication-level extractions; repeated assertions across papers can resolve to the same relationship. The paper reports 6,530 distinct entity-to-entity relationships asserted by publications. Keeping these counts separate helps explain what the literature actually contributes.
The dataset release distinguishes v1, the 2,000-publication graph evaluated in the paper, from v2, an expanded graph covering 10,910 publications. The results discussed here refer to the paper's graph. The Python example below explicitly selects v1.
How do extracted relationships get checked?
An LLM reading a PDF can produce plausible mistakes. ClimateKG therefore checks extracted information before adding it to the graph.
The construction pipeline follows these steps:
- Extract a candidate relationship and its evidence. The extractor identifies the entities, their types, the relationship, and a supporting passage.
- Check the ontology. A deterministic check verifies that the combination of entity types and relationship is permitted by the schema.
- Locate the evidence. A text-matching check verifies that the supporting passage can be found in the parsed source document.
- Check what the evidence supports. An LLM validator assesses whether the passage supports the proposed relationship.
- Resolve entity names. Entity linking connects mentions to existing graph entities where appropriate, helping reconcile names across papers and metadata.
These checks serve different purposes. The ontology keeps the graph structurally consistent. Evidence matching preserves a route back to the text. Semantic validation assesses whether that text supports the assertion. A schema-compatible relationship can still be wrong, and a passage that exists in a paper can still be misinterpreted.
In the reported evaluation, 98.96% of the 23,327 retained publication triplets were judged correct by an LLM evaluator. A separate study of 1,000 triplets sampled before filtering compared the validator with three human annotators; agreement was comparable to agreement between the human annotators.
Here, “correct” means that the source passage supports the extracted relationship. It does not establish that a finding is universally true, that the graph captures every relevant fact, or that every edge in the full graph has been manually verified.
Where could this help climate scientists?
The following are potential research workflows. The paper demonstrates graph construction and evaluates extraction quality; it does not measure improvements in ensemble design, scientific discovery, or researchers' time savings.
1. Investigating shared model components
When comparing model outputs, you may want to examine how models are related through shared components or inherited development history.
ClimateKG includes model-to-component connections and component-to-realm connections. A researcher could use those paths to identify candidate groups of models sharing an atmospheric or ocean component, then inspect the relevant documentation and papers. One of the example questions in the paper asks which component of CanESM5 applies to the ocean realm.
This could support the documentation stage of an ensemble study. A shared component is a reason to investigate possible dependence; it does not, by itself, quantify dependence in a particular variable or region. Any weighting or model selection decision still needs an appropriate scientific analysis. Sparse genealogy links also mean that a missing connection should not be read as evidence of independence.
2. Connecting simulated variables with observations
Suppose you want to evaluate a regional model against observations. Before comparing values, you need to identify what the model produces and which instruments or datasets measure the relevant variable.
The paper gives a concrete graph question: which variable is both produced by the REMO2009 regional climate model and measured by Vaisala sondes RS80/RS92/VS41?
That question follows two paths to a shared variable: one from a model and another from an instrument. It illustrates how the graph could help assemble candidate observation–simulation pairings and locate related literature.
The next step remains essential: check units, sampling frequency, vertical coordinates, spatial coverage, and experiment context. A shared variable connection establishes a useful lead, rather than a ready-to-run validation dataset.
3. Finding methods, datasets, and reported results together
A literature review often requires more than a list of papers. You may need to record which method each study used, which observational dataset it evaluated, and which metrics or results it reported.
ClimateKG connects these entities. For example, the paper's downstream query examples include finding a result associated with a method that uses Antarctic ice-core water stable isotopes. A graph traversal can bring the method, dataset, result, and publication into the same working view.
This could provide a starting point for a review spreadsheet or evidence table. Researchers would then read the source passages and check experimental conditions before comparing findings. Metric names alone do not make results comparable: periods, reference datasets, ensemble members, and definitions can change their interpretation.
4. Building a focused reading list
A new student or a researcher entering an unfamiliar subfield could start with a model, variable, observational dataset, or region, then explore connected papers and methods.
Compared with repeatedly searching for keywords, explicit relationships offer a way to narrow a reading list by how a paper uses an entity. A paper that uses a model and a paper that merely mentions it need not answer the same research question. The query below starts with the graph's PAPER_USES_MODEL relationship for that reason.
These connections can also guide follow-up searches when coverage is thin. However, an empty result may reflect corpus selection, extraction limits, or the ontology's scope. It cannot establish that a topic has never been studied.
The same evidence links could support a future research assistant that retrieves graph paths and their supporting passages before drafting an answer. Such an assistant would need its own evaluation, including checks that citations support its claims and that scientific qualifiers survive retrieval.
Try it: find papers that use CESM2
You can explore the released graph as Python tables without running the extraction pipeline or setting up a graph database. The Hugging Face dataset card documents the node and edge columns.
Install the dataset loader in your Python environment:
pip install datasetsThen load the paper's version and find publications connected to CESM2:
import json
from datasets import load_dataset

nodes = load_dataset(
    "aayushacharya/climatekg", "v1-nodes", split="train"
).to_pandas()
edges = load_dataset(
    "aayushacharya/climatekg", "v1-edges", split="train"
).to_pandas()

# Source is the graph's label for a climate model.
model_ids = nodes.loc[
    nodes["label"].eq("Source") & nodes["name"].eq("CESM2"), "uuid"
]
paper_ids = edges.loc[
    edges["relation"].eq("PAPER_USES_MODEL")
    & edges["target"].isin(model_ids),
    "source",
]
papers = nodes.loc[
    nodes["label"].eq("Paper") & nodes["uuid"].isin(paper_ids)
]

for paper in papers.head(10).itertuples(index=False):
    metadata = json.loads(paper.properties)
    print(paper.name)
    print(metadata.get("doi") or "No DOI recorded")
    print()
In the v1 release checked for this post, this query matched 111 paper nodes and printed the first ten titles and DOIs. It returns a reading list from the relationships present in the graph. Try another exact model name from the node table to explore a different part of the graph.
If you count the downloaded edges, you will see 755,310: two more than the paper's 755,308 relationships. The dataset card records the table-export and loaded-database counts separately.
For a closer audit, the released per-paper pipeline outputs contain candidate triplets, evidence passages, and validation flags. Match the paper's OpenAlex id in its node properties to the per-paper records, and inspect the evidence behind the relationship of interest. The original PDFs and parsed full texts are not bundled with the release.
If you prefer graph queries, the repository also supplies Neo4j loading instructions and graph dumps. Use a dedicated empty database: the supplied loader clears its target database before importing the graph.
Reading the graph responsibly
There are three practical limits to keep in mind when using ClimateKG.
Coverage is selective. The paper's corpus began with IPCC AR6 references and CMIP6 publications, followed by citation expansion and relevance screening. It is a defined collection of climate literature, rather than a complete index. The paper also does not report exhaustive triplet-level recall.
Context still matters. Experiments, forcings, regions, periods, and ensemble members can qualify a scientific statement. The graph represents some context through additional nodes and paths, but the supporting passage and original paper remain necessary when interpreting a result.
Multiple supporting papers do not necessarily mean independent evidence. ClimateKG can retain several paper identifiers for an assertion, but the current provenance design does not distinguish the paper that introduced a finding from papers that repeat it. The number of supporting papers should therefore be interpreted with care.
My hope is that ClimateKG gives climate scientists a useful starting point for connecting documentation, literature, and research questions. If you try it on a specific problem, share an example or report a missing connection. Concrete cases can help identify where the corpus or schema needs to improve.
Cite ClimateKG
If you use ClimateKG's graph, pipeline, or methodology in your research, please cite our paper. Also cite the original studies and datasets that support your scientific conclusions.
@misc{acharya2026climatekg,
  title         = {Ontology-Guided Knowledge Graph Construction from Structured Metadata and Climate Science Publications},
  author        = {Acharya, Aayush and Zhang, Qi and Dragut, Eduard and Latecki, Longin Jan},
  year          = {2026},
  eprint        = {2610.32725},
  archivePrefix = {arXiv},
  primaryClass  = {cs.CL},
  url           = {https://arxiv.org/abs/2610.32725}
}
The repository also provides the AACL 2026 citation. Code is released under MIT and the graph data under CC BY 4.0; see the data license for attribution and source-specific terms.